Gym Digital Twin
Functional decision-support prototype built from anonymized, multi-year local sales and access exports. It has been used to analyze member frequency, attendance-based churn risk, retention signals and business activity, alongside forecasts and scenarios. Findings remain under observation; no resulting business decision or measured improvement is claimed yet.
The product, shown without personal or sensitive data
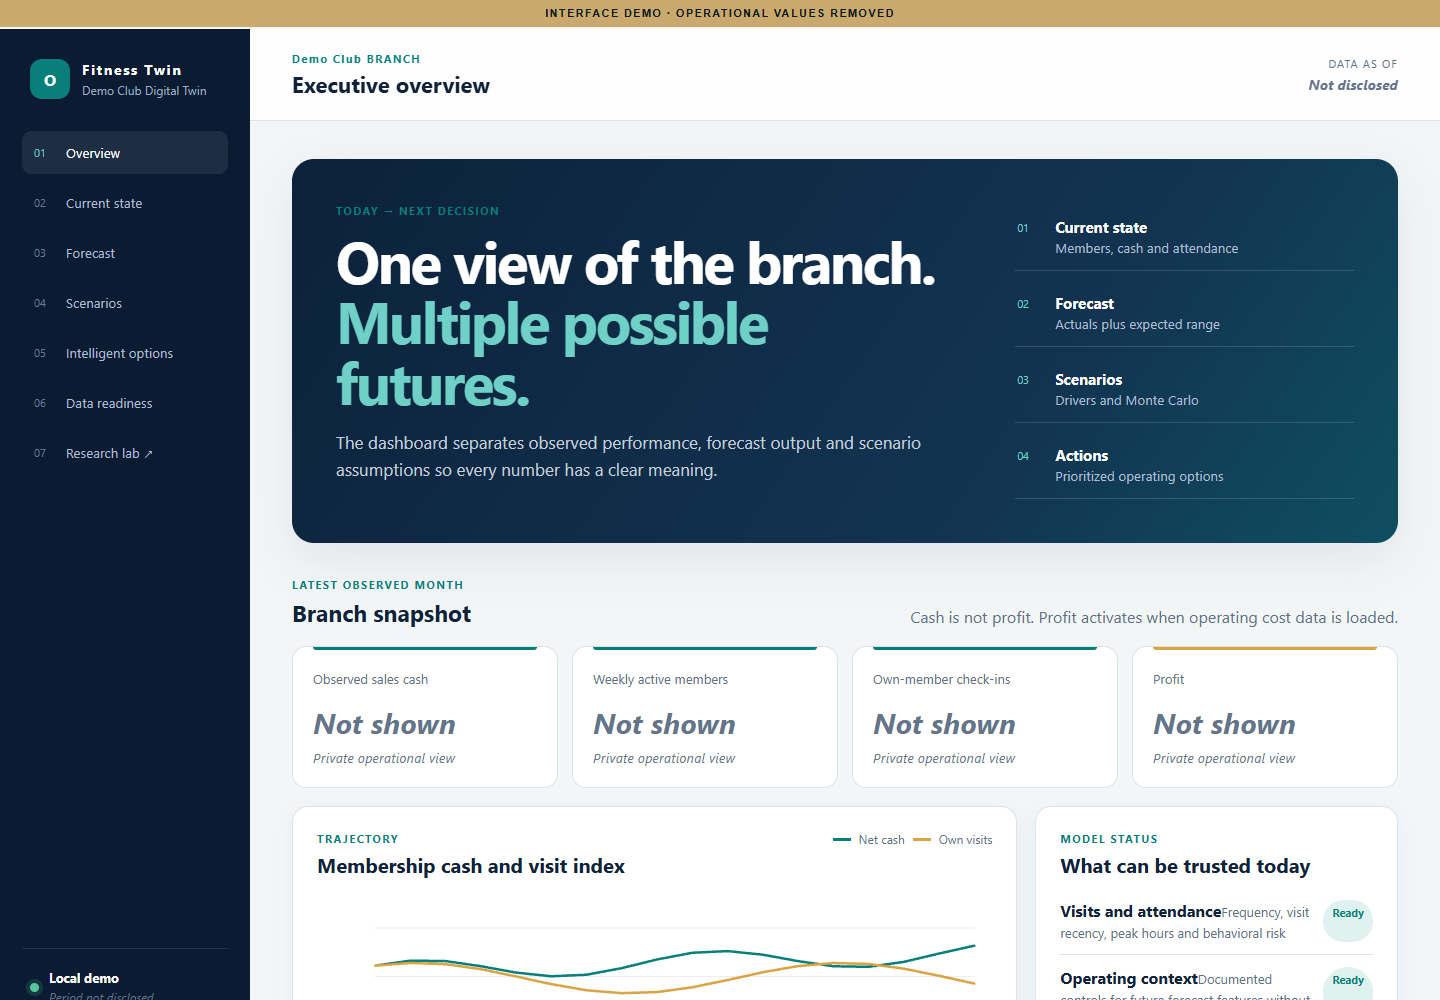
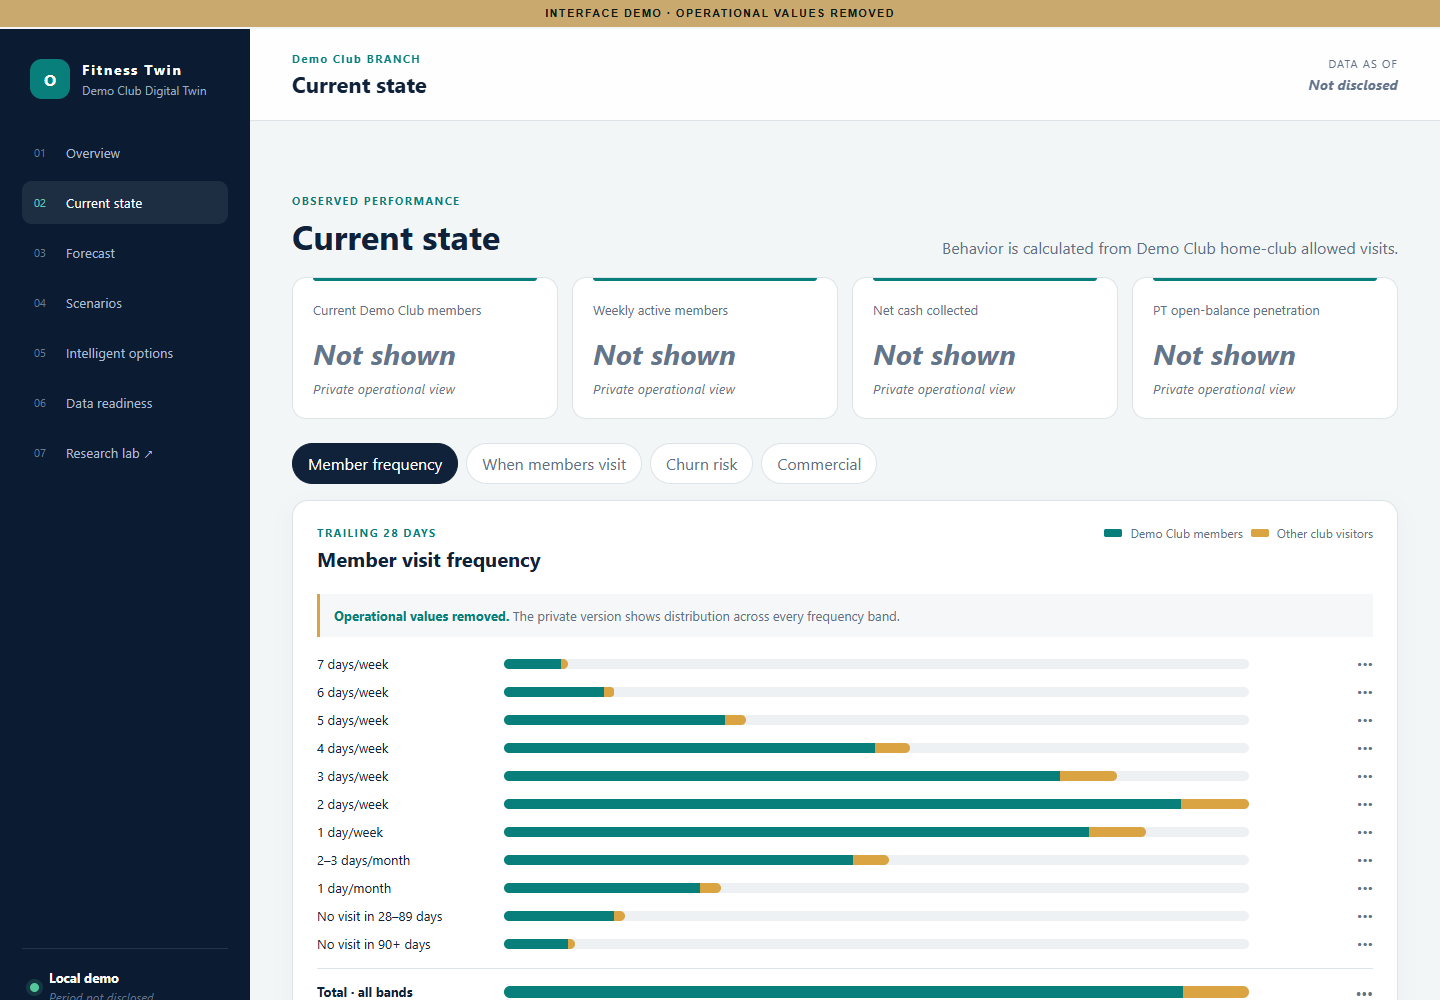
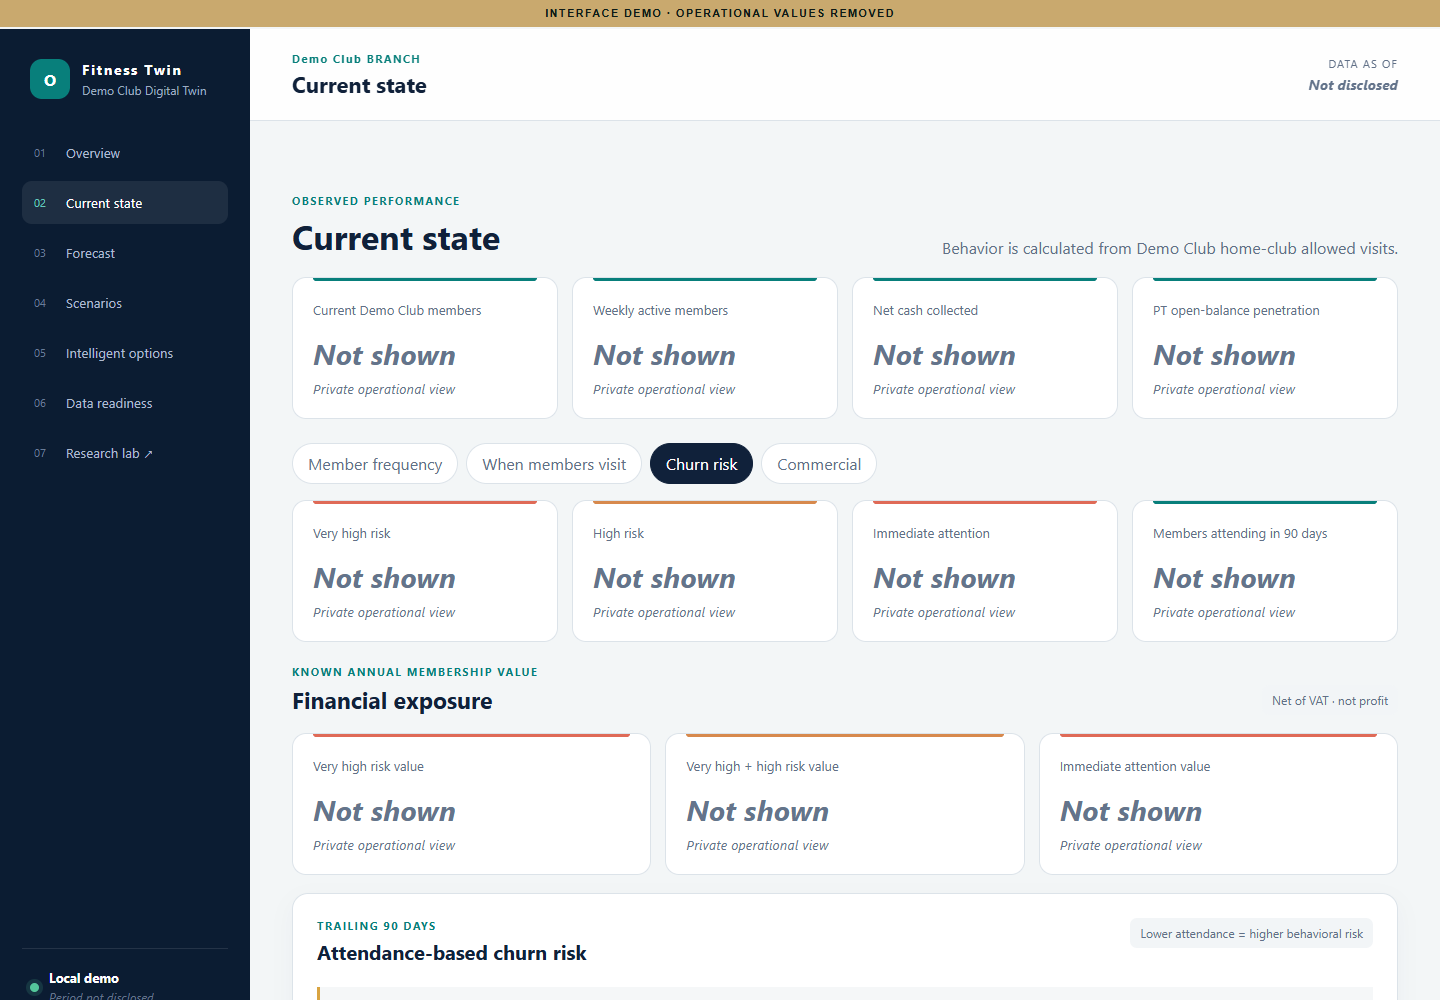
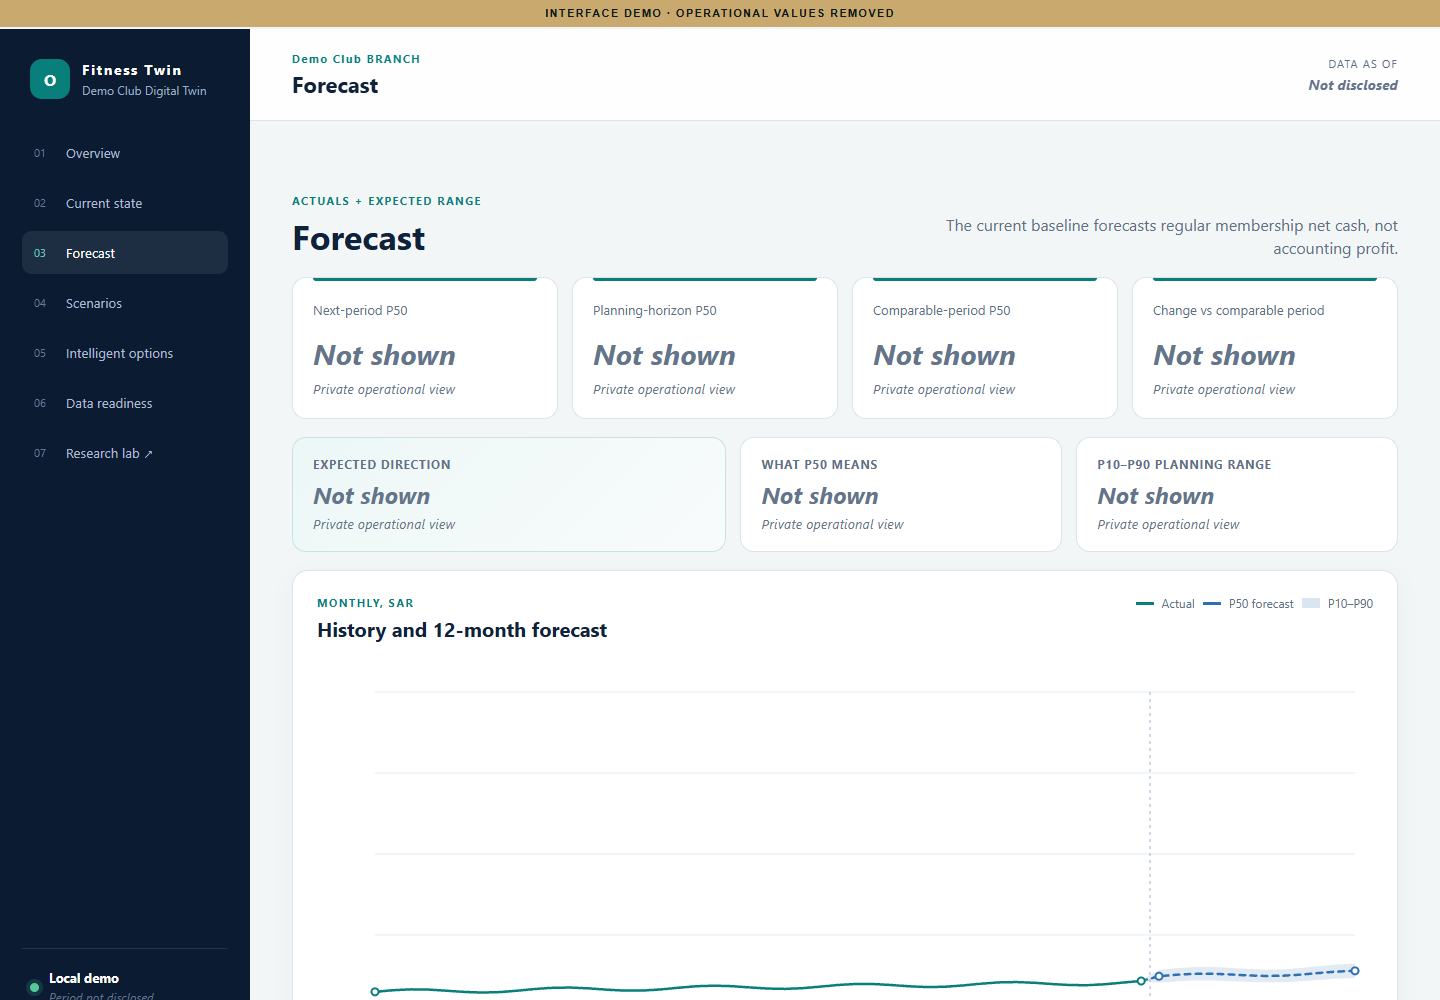
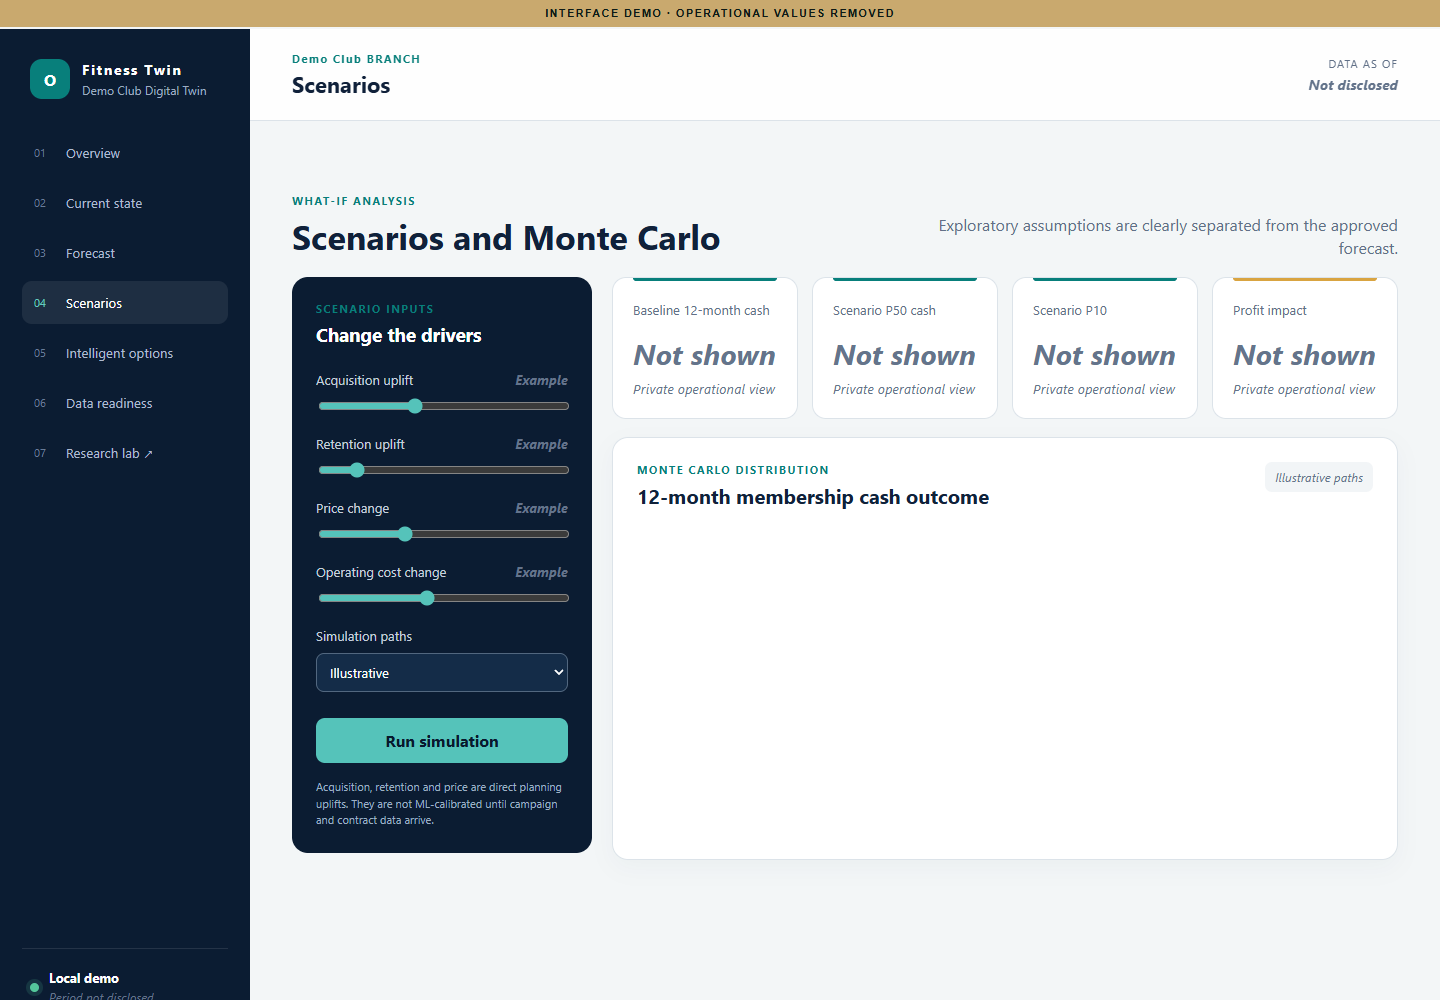
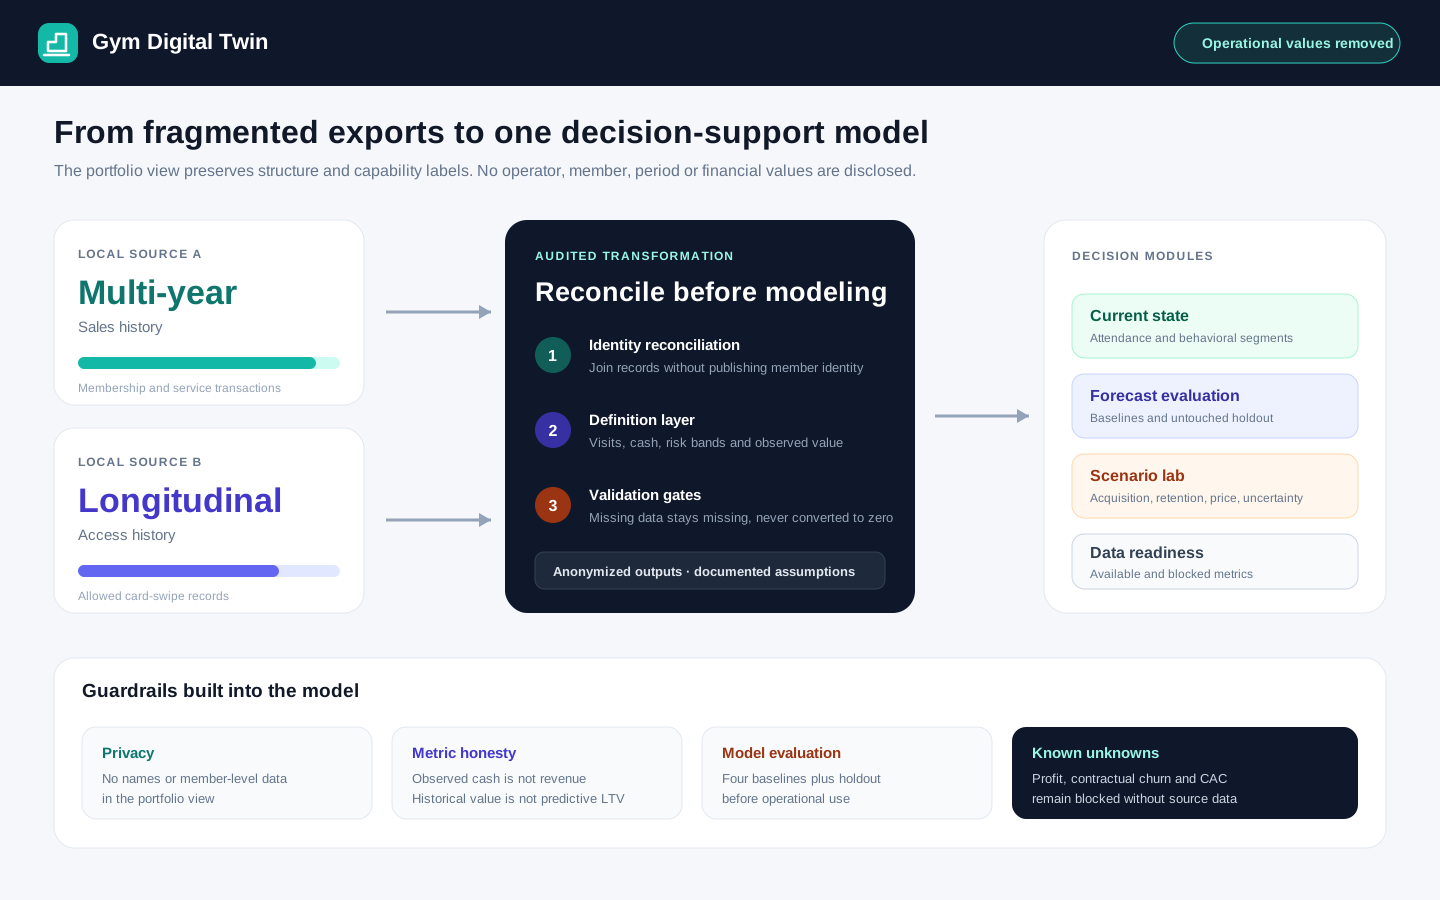
Questions the current prototype can answer
These questions use observed behavior and synthetic portfolio illustrations. Attendance-based churn risk is actionable as a service signal, but it is not the same as verified contractual churn.
How frequently are members visiting the club?
The current-state module groups the member universe into mutually exclusive frequency bands over the trailing 28 days and separates own members from visitors from another club.
When does demand concentrate during the week?
Hourly and weekday views reveal demand patterns from allowed check-ins, supporting staffing and service planning without claiming simultaneous occupancy.
Which members show behavioral churn risk and need attention?
Visit recency and distinct visit days segment members from very high risk to highly engaged, including an immediate-attention group. This is an attendance signal, not confirmed contract cancellation.
How much known membership value is exposed within the behavioral risk groups?
The model connects risk segments with the latest matched positive membership sale and reports coverage instead of imputing missing prices.
How are membership cash, personal-training activity and observed customer value evolving?
Commercial views connect observed cash, PT purchases, recorded service use and historical relationship value while keeping cash, revenue and profit conceptually separate.
What could happen over the next 12 months under different assumptions?
The forecast shows a central estimate and uncertainty range, while the scenario engine explores acquisition, retention and price assumptions through Monte Carlo simulation.
What is implemented today
- Integration of anonymized sales and access exports into a consistent longitudinal model.
- Reconciliation of metric definitions, validation checks and explicit treatment of missing information.
- Current-state views for attendance, visit frequency and behavioral risk segments.
- Historical value and observed cash views with clear accounting and interpretation limits.
- Comparison of multiple forecast baselines against an untouched holdout period.
- Acquisition, retention and pricing scenarios with Monte Carlo exploration and data-readiness controls.
Context
Operational data existed across fragmented sales and access exports.
Problem
Teams lacked a single decision layer connecting how members use the club, where behavioral risk appears, how commercial activity evolves and what could happen under different assumptions.
My role
Data integration, modeling, evaluation and interface development.
What I built
A working local executive dashboard with six modules: overview, current state, forecast, scenarios, intelligent options and data readiness. It includes reconciled operational views, behavioral risk segments, PT usage, historical customer value, baseline comparisons, holdout evaluation and Monte Carlo scenario exploration.
Progress achieved
The analysis has addressed questions about member frequency, attendance-based churn risk, retention signals and business activity in one interface. The current achievement is analytical visibility. Findings are still being observed and have not yet been linked to a concrete business decision or a measured operational improvement.
Data or evidence used
Anonymized, multi-year local sales and access exports.
Limitations
The model is not approved for operational prediction. Portfolio screens reproduce the interface with operational values and dates removed, and do not disclose the operator identity, private financial information or member-level data.
Next validation step
Continue observing findings across additional periods, assess stability and document drift. Define a specific decision and its success measure before testing an intervention, then follow up whether that action changes the outcome. Forecasts remain subject to baseline and holdout evaluation before operational use.